Important Disclaimer
eBikeGarageHQ provides educational content and estimates only. We are not certified installers, financial advisors, or electricians. Always consult with licensed professionals.
E-bike energy use is measured in watt-hours per kilometre (Wh/km), and terrain is the variable that moves it most. On my logged loops, flat tarmac at low assist runs about 7–8 Wh/km, a typical rolling commute lands near 11–13, and a genuinely hilly route at higher assist climbs to 16–19 Wh/km. Same bike, same battery — the road decides how far you go.
That spread is why a single "range" number is meaningless without context. I treat Wh/km the way I treat any reading on my battery bench: a measured quantity, logged against conditions, not a marketing estimate. This guide breaks down what each terrain type actually costs and why, so you can budget your own distance honestly. It’s the consumption half of the equation in the broader e-bike range guide, and it pairs directly with the method in my real-world range calculator.
Why Terrain Dominates Energy Use
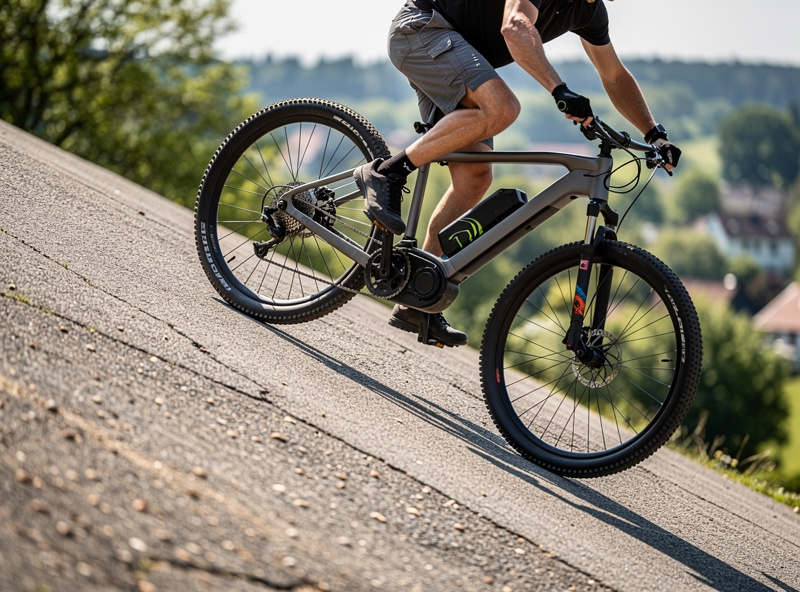
Climbing costs energy because the motor and your legs together must lift the entire system — bike, battery, rider, cargo — against gravity. That work is physical and unavoidable: a 100 kg rider-plus-bike gaining 100 m of elevation requires a fixed amount of energy no clever motor can dodge. Distance barely matters by comparison; a flat 20 km can cost less than a hilly 10 km. Where the mass sits on the bike also shapes how those climbs feel to ride — the e-bike weight distribution and ride feel guide covers how hub-drive versus mid-drive positioning changes balance and handling on the same terrain.
On the flat, your energy goes almost entirely to rolling resistance and air drag, both of which are modest at sensible e-bike speeds. That’s why flat Wh/km is so low and so stable. Add gradient and the gravity term swamps everything else. This is also why total elevation gain on a route tells you more about consumption than the route’s length — I plan hilly rides by metres climbed, not kilometres covered.
Wh/km by Terrain Type
Here’s how my logged consumption breaks down by terrain, at typical medium assist with real pedalling. These are honest figures from my own loops, not lab numbers — treat them as a starting reference until you’ve measured your own bike.
| Terrain | Typical Wh/km | What drives it | Range on 450 Wh usable |
|---|---|---|---|
| Flat tarmac, sheltered | ~7–9 Wh/km | Rolling resistance only | ~50–64 km |
| Gentle rolling | ~10–12 Wh/km | Small repeated climbs | ~37–45 km |
| Mixed urban with stops | ~12–14 Wh/km | Stop-start acceleration | ~32–37 km |
| Hilly | ~16–19 Wh/km | Sustained gravity load | ~24–28 km |
| Steep / mountain | ~20–26 Wh/km | Long high-power climbs | ~17–22 km |
| Loose gravel / soft ground | ~14–20 Wh/km | High rolling resistance | ~22–32 km |
Notice mixed urban riding costs more than gentle rolling despite being flatter — every stop sign means re-accelerating the whole system from zero, and acceleration is its own energy cost. Stop-start city riding is quietly expensive.
Assist level interacts with terrain in a way the table can’t fully capture, so it’s worth saying plainly: the steeper the ground, the more the motor’s chosen assist level multiplies your energy use. On the flat, the difference between low and high assist is real but modest, because you barely need help. On a sustained climb, high assist can easily double Wh/km versus a middle setting, because the motor is multiplying a large effort rather than a small one. That’s why my own habit is to ride flats at low assist and save the higher settings for hills — the climbs are where assist earns its keep, and where dialling it back costs you the most in sweat. The terrain rows above assume sensible, terrain-matched assist rather than pinning the top setting everywhere; match assist to gradient and your real numbers will track the table closely.
Surface and Rolling Resistance
Terrain isn’t only about up and down; the surface underneath matters too. Smooth tarmac is the cheapest thing you can ride on. Loose gravel, sand, mud and grass all spike rolling resistance — the tyre sinks and deforms, and energy that should move you forward gets wasted churning the surface. On a loose forest track I’ve watched Wh/km jump toward hilly-route territory even on flat ground.
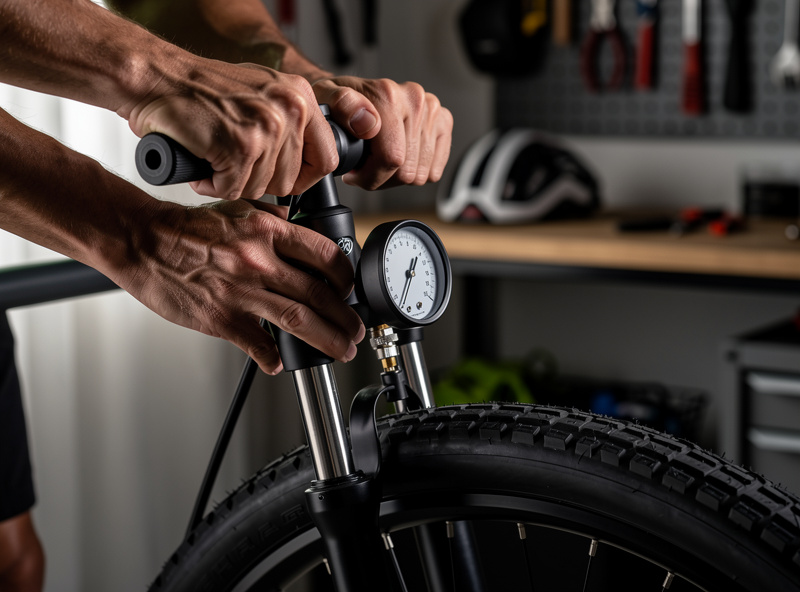
Tyre pressure is the lever you control here. A properly inflated tyre rolls efficiently; a soft one acts like permanent soft ground, dragging your Wh/km up everywhere. Checking pressure before a ride is the single cheapest range habit there is — it costs nothing and recovers energy you’d otherwise lose on every kilometre. I keep a floor pump with a gauge by the door and top up weekly.
As an Amazon Associate I earn from qualifying purchases. Gear links are search links; no price is shown beside them.
Speed and Wind as Terrain
Two more factors behave like terrain even though they aren’t roads. Speed matters because air drag rises steeply with it — doubling your speed roughly quadruples the drag force, so holding a fast pace burns disproportionately more Wh/km than cruising. Headwind does the same thing from the outside: a sustained headwind is, in energy terms, a hill that never crests.
This is where legal class quietly enters the consumption story. In the EU, a pedelec assists up to 25 km/h on a 250 W rated motor, which keeps drag — and Wh/km — modest. A US Class 3 bike assists to 28 mph (~45 km/h); held at that speed, the drag penalty is much larger and consumption climbs accordingly. Neither is wrong, but a faster class spends range to buy pace. Always confirm your local rules; this is how the classes are defined, not legal advice.
How to Log Your Own Wh/km
Generic numbers get you started, but your own log is what you should trust. Charge to full, ride a fixed loop that represents your real terrain, and at the end divide the watt-hours used (from your display, or measured at the wall) by the kilometres ridden. Log the figure next to the temperature and assist level. Do this across flat, rolling and hilly routes and you’ll build a small personal table that beats any spec sheet.
The wall measurement is the honest one: a plug-in watt-meter shows exactly how much energy went back into the pack, which over time also reveals your true usable capacity as the battery ages. It’s the same logging discipline I run on every stationary pack — Wh behaves identically whether it’s climbing a hill or sitting on a shelf. Once your table exists, plug its numbers straight into the range calculator method for a distance estimate you can rely on.
Related Guides
- E-Bike Range Guide — the full cluster and planning grid.
- Real-World Range Calculator — turn your Wh/km into a distance estimate.
- Manufacturer Range Claims Tested — how my logged Wh/km figures compare to the spec-sheet numbers.
Frequently Asked Questions
What is a normal Wh per km for an e-bike?
Flat low-assist riding runs about 7 to 9 Wh per km, a typical rolling commute about 11 to 13, and hills or high assist about 16 to 19. Steep mountain climbs can exceed 20 Wh per km. Terrain is the biggest factor.
Why does hilly terrain use so much more energy?
Climbing requires lifting the whole system of bike, battery and rider against gravity, which is a fixed physical cost no motor can avoid. On flat ground energy goes only to rolling resistance and air drag, which are far smaller.
Does tyre pressure affect e-bike energy use?
Yes. A soft tyre deforms and drags like permanently soft ground, raising Wh per km on every kilometre. Keeping tyres at correct pressure is the cheapest way to lower consumption, costing nothing but a weekly check.
Does riding faster increase Wh per km?
Yes. Air drag rises steeply with speed, so holding a fast pace burns disproportionately more energy per km. An EU pedelec capped at 25 km/h is more frugal than a US Class 3 bike held at 28 mph over the same route.
How do I measure my own Wh per km?
Charge to full, ride a fixed loop normally, then divide the watt-hours used by the kilometres covered. Read the watt-hours from your display or measure them at the wall with a plug-in meter, and log the result with temperature and assist.
More from This Cluster
- “Manufacturer E-Bike Range Claims
- “E-Bike Range Anxiety vs Range Math: Trusting the Numbers”
- “E-Bike Assist Level and Battery Use: Where the Wh Go”
- “Cold Weather E-Bike Range Loss: What a Winter Log Shows”
- “E-Bike Range Calculator: Real-World Numbers
- “E-Bike Range Guide: How Far You Actually Go on a Charge”